


Troubleshooting Performance Issues in Azure VMs: Lessons Learned
We’ve all been there. Your software business is growing, the roadmap is on track, and everyone is focused on new value—until a customer reports unexpected performance issues in Azure VMs running your application.
What changed? Was it the environment, the code, or something hidden in the infrastructure? Troubleshooting application performance in cloud environments can feel like searching for a needle in a haystack. Without a clear process, you risk wasting time chasing symptoms instead of solving the root cause.
At Cycle Labs, we faced this exact challenge when our flagship enterprise testing platform wasn’t performing in a customer’s Azure environment. What followed was a real-world exercise in Azure VM performance troubleshooting—and the lessons we learned can help any team facing similar issues.
Start with the Basics: “Is it plugged in?”
We say this facetiously, but this age-old adage is just as relevant today as it ever was. In the modern era of cloud computing and virtual hardware, we must always remind ourselves to check the simple things first, even if what we define as “simple” changes over time.
For context, our flagship product is a downloadable software program that runs on Microsoft Windows. Some of our customers run it on their own physical devices (primarily laptops); whereas, others run it inside virtual machines in the cloud. Regardless of how they’ve chosen to deploy the software, there are a lot of boilerplate questions we ask upfront.
Build a Standard Troubleshooting Questionnaire
It’s extremely helpful to have a standard questionnaire that can be used to gather pertinent details for the engineers. Some sample questions are as follows:
- What type of processor is being used (or how many virtual cores)?
- How much memory/RAM is available?
- Which operating system and version?
- Which processor architecture (x86, AMD64, ARM, etc.)?
- Which variant and version of our application is installed?
- Is there anything unique about how they’ve chosen to install or run the application?
If you’re reading between the lines, then you’ll see that “is it plugged in?” is intended to get you thinking about the environment in which the application is running, rather than about the application itself. One of the biggest challenges with delivering prepackaged software is anticipating all of the ways your customers will ultimately try to use it. Publishing a list of system requirements is a great way to establish some “plausible deniability,” but you’ll still want to be flexible as this will help you land (and keep) more customers.
Understanding Azure Virtual Machine Performance
One of the first things we established while working with our customer is that they were running our application in a virtual machine on Microsoft Azure. There are many types of virtual machines that are designed for different workloads, so it’s important to validate that your customer has selected the appropriate class of VM based on the workload your software is likely to produce.
Said another way, just because two VMs have the same RAM and core count, it doesn’t necessarily mean they’ll perform identically.
Our customer indicated that they were running our software on a “Standard B2ms” virtual machine. Quantitatively, the specs of this VM (2 vCPUs, 8 GB RAM) should have been sufficient for their use case. However, qualitatively, we had some concerns about the specific VM class/SKU they selected.
Burstable vs. Dedicated VMs: What’s the Difference?
The “B” in “B2ms” stands for “burstable.” Burstable VMs are an advent of cloud computing and they behave somewhat differently than traditional VMs. They offer stable performance under low loads, but have the ability to “burst” for short periods of time to adapt to sudden spikes in demand. They are great for request-driven workloads, such as websites and web services. A typical web server will spend most of its time “listening” for requests to come in before it performs any significant work, so cloud providers invented “burstable” VMs as a budget-friendly alternative to traditional, “dedicated” VMs.
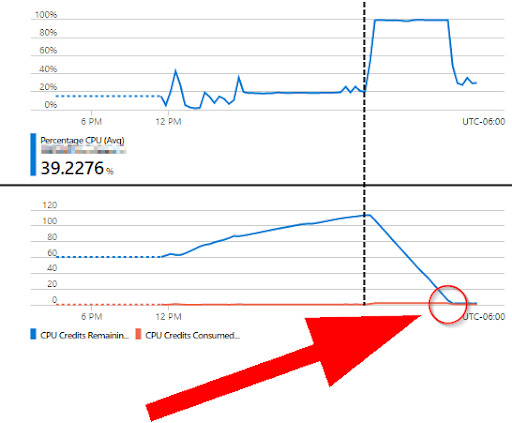
But, be forewarned: If the CPU utilization remains too high for too long, the VM will begin to consume “credits.” Once those credits have been depleted, the cloud provider will slow the VM to a crawl until the credits replenish.
Have you ever played a video game where a piece of equipment works great at first, but if you hold the button too long, it overheats and locks you out–leaving you defenseless to the nearby enemies–until it cools down? Yeah, it’s sort of like that.
Our customer was using our software to simulate multiple users (20+) performing tasks in a warehouse/distribution center concurrently. Unlike a request-driven workload, this workload often results in prolonged, sustained, high CPU utilization. Additionally, they would often run this simulation for multiple hours continuously.
With this information in mind, we began to suspect the burstable VM may be part of the problem. At the very least, it was adding another layer of variability that would make our analysis more difficult. The scientific method states that we should only change one variable at a time, so in order for us to effectively troubleshoot the problem, we asked our customer to change the “burstable” VM to a “dedicated” VM. With this change in place, our engineers could rest assured that Azure wouldn’t adjust the CPU speed in the background and skew the results of their experiments.
Who’s Competing for Resources?
We don’t mean that in a business sense, but rather, a technical sense. Compute and memory resources are finite, and every process running alongside your application will be competing for “a slice of the pie.” And now that we had a comprehensive view of the hardware (the “pie” in this analogy), it was time to take a closer look at the software (the “slices”).

In the B2B software space, you’re bound to work with companies with vastly different security requirements. Typically, the larger the company, the more stringent their security. This can make it difficult to apply a “one size fits all” approach to debugging.
Monitoring Other Applications on the VM
Since this particular customer was quite large, we knew that they had rigorous security practices in place. So, before conducting any experiments, we first did a comprehensive review of the software installed on the VM. Endpoint security programs–such as virus scanners–are known to interfere with applications that are either a) bespoke in nature or b) demand a lot of resources from the OS. Unfortunately for us, our product falls into both of these categories.
Security Tools and Their Impact on Performance
The easiest way to tell if a virus scanner is impacting the performance of your application is to monitor it (i.e., “watch the watchdog”). While running our experiments, we always had the OS process manager visible so we could see which applications were using the most resources. During our experiments, we’d typically see our application using about 75% of the CPU, and the remaining 25% was spread across other system/OS processes, none of which were using a disproportionate amount. To us, this seemed perfectly normal. A virus scanner could easily perceive this sudden spike in CPU usage as a threat, and if it was attempting to intervene, we would have expected to see the virus scanner’s CPU usage rise in kind.
Since this wasn’t happening, we were fairly confident that our application’s performance wasn’t being negatively impacted by other software on the VM. Perhaps not confident enough to completely rule it out, but confident enough to begin looking elsewhere.
Pro tip:
Try not to chase the rabbit too far down the hole. When faced with an open-ended task, it’s helpful to set time limits on each idea you’re pursuing. If you spend too much time pursuing one avenue, you may be digging deep in the wrong direction and overlooking something simpler at the surface. As a good rule of thumb, set a timer for 1 hour. If you haven’t made measurable progress after 1 hour, take a break. we’ve found it immensely helpful to stand up, walk around, and revisit the problem later with a fresh set of eyes and a clear mind.
Check Your Dependencies
Very rarely do modern software applications run completely on their own. Many are built on top of a framework, shared library, or runtime.
Troubleshooting Java Applications on Azure VMs
For better or for worse, our application runs on Java. Java is not known for being the most efficient platform for high-performance applications, but it is robust. There are a myriad of tools you can use to “peek” inside the Java Virtual Machine (herein, “JVM”) to get a better sense of what’s happening under the hood.
JVM Heap Size and 32-bit vs. 64-bit Considerations
One of the tools we employed was VisualVM. VisualVM is a standalone application that allows you to inspect other applications running on the JVM. We opened VisualVM alongside our application and began drilling into the data while our application was running. One thing we noticed fairly quickly was that the heap size of our application seemed to be “stuck” at exactly 256 MiB (268,435,456 bytes). Considering a single Chrome tab can consume this amount of memory without breaking a sweat, we were thinking it was probably a tad light for our complex, enterprise-grade application:

With this new discovery, we started to develop a hypothesis:
“If we can somehow figure out how to make more memory available to Java, we’re confident the performance of our application will improve.”
Java has command line arguments that can be used to adjust parameters such as max heap size, but we practice what we preach: rather than spending time researching the various JVM command line arguments and their potential implications, we decided to “Keep It Simple, Stupid” by taking a second look at the software installed on the VM. Only then did we realize there were multiple Java versions installed, some of which were fairly outdated. We also observed that the system-default Java was 32-bit despite the OS being 64-bit. One of the main advantages of 64-bit code is its ability to access more memory than an equivalent 32-bit application, and since our application was having trouble accessing enough memory to do its job effectively, we used this correlation to further validate our hypothesis.
Before communicating our findings with our customer, we wanted to be sure we were on the right track. So, with their blessing, we installed a newer version of 64-bit Java on the VM and repeated our test. Within seconds of starting our application, we immediately saw the heap size jump to over 1 GB. While this was alarming at first, the heap size leveled out quickly once all of the dependencies had fully loaded. We also saw a dramatic improvement in application speed and responsiveness:

Examine Application Behavior Over Time
Identifying Memory Leaks and CPU Spikes
Now that the performance of our application had been “uncapped,” we monitored it for a good while to ensure that the performance did not degrade over time. To our delight, it did not. If there was some sort of pervasive issue with our code – such as a memory leak – we would have seen the heap size continue to rise until hitting our new self-imposed maximum of 4 GB. This could easily lead to a never-ending loop of frustration: increase available memory, watch the application grow to fill the available space, and repeat.
Stress Testing with Higher Workloads
Before providing a final recommendation to our customer, we doubled the workload of our application from 20 workers to 40 workers. We wanted to ensure there was a safe margin of error above and beyond their current use case in case their needs change in the future. We repeated this experiment a few times using different VM sizes until we achieved an acceptable compromise between cost and user experience, which led us to our recommendation of a D4s V3 VM coupled with a 64-bit JVM.
Key Takeaways for Azure VM Performance Troubleshooting
Troubleshooting Azure VM performance is rarely straightforward, but having a structured approach makes all the difference. From our experience, here are the essential steps:
- Review the hardware: Check system specs and VM class (“is it plugged in?”).
- Evaluate competing software: Understand how other applications or security tools affect resources.
- Check dependencies: Validate frameworks, libraries, and runtimes (e.g., JVM and heap size).
- Consider the workload: Match VM type to the nature of the tasks (burstable vs. dedicated).
- Observe application behavior: Monitor for memory leaks, CPU spikes, and sustained usage patterns.
By following these principles, we identified the root cause of our customer’s performance issues and delivered a stable, scalable solution using a dedicated Azure VM and 64-bit Java.
Performance problems can stall your momentum, but with the right process, you can turn troubleshooting into an opportunity to strengthen reliability, reduce risk, and deliver better customer experiences.
Interested in learning more? Explore how Cycle® helps enterprises automate testing and ensure performance across complex environments.

